Drug Overdose Fatality Data
Information on fatalities due to drug overdose in the City of St. Louis.
The aggregate data shown below is organized into four categories: overdose fatalities by year since 2017, overdose fatalities by month since 2021, overdose fatalities by race since 2018, and overdose fatalities by drug type since 2022.
Data is provided by the Office of the Medical Examiner and is provisional and subject to change as additional information is reviewed.

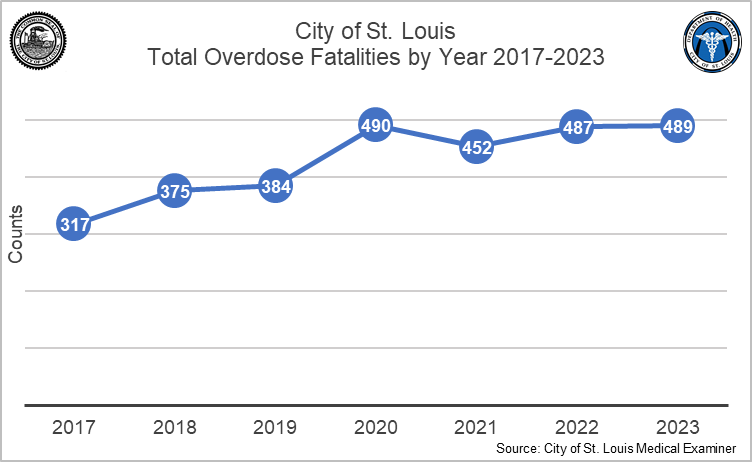
The line graph above shows the total number of overdoses in the City of St. Louis from 2017 to 2022. There is a general upward trend with a high point of 490 fatalities in 2020.

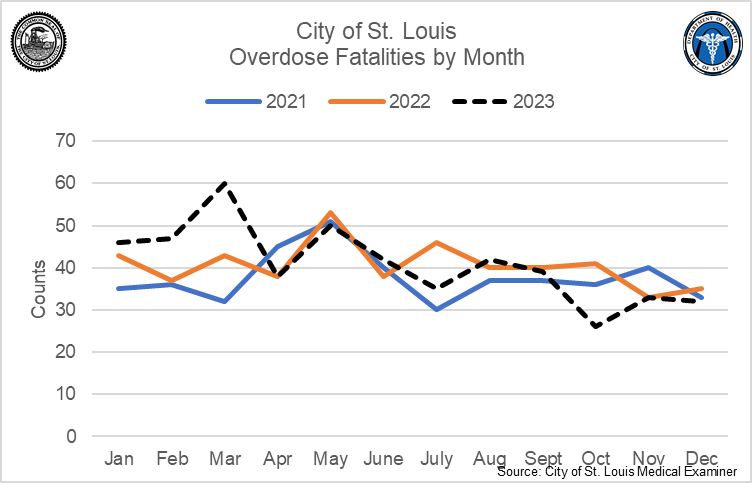
The line graph shows the time trend over each month of 2021, 2022, and 2023. While 2021 and 2022 followed very similar trends across the year, the number of overdose fatalities in the beginning of 2023 was higher than previous years. Since April, fatality counts have been similar to or lower than 2021 and 2022.

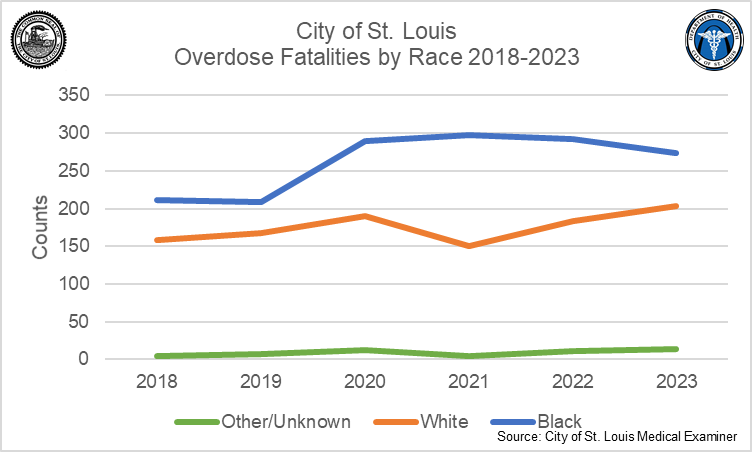
The line graph above shows overdose fatalities by race in the City of St. Louis between 2018 and 2023. In all years, counts of Black fatalities were much higher than White or Other Race fatalities. Since 2022, this disparity is decreasing, with an increase White and Other Race fatalities and a decrease in Black fatalities.

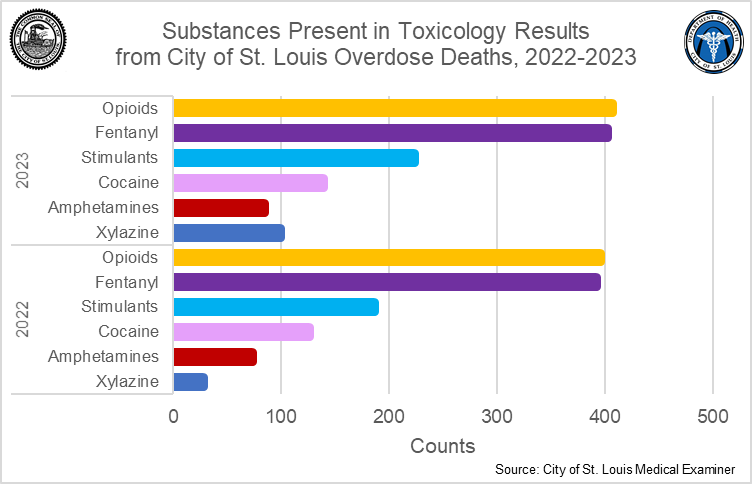
The horizontal bar graph above shows substances present in overdose fatalities in the City of St. Louis for the years 2022 and 2023. Most overdose deaths during those years in the city involved multiple substances. Each substance from those toxicology case results is included individually in our analysis. Therefore, the total drug count for the chart above adds up to more than the total drug overdose fatalities for that year (displayed in the top chart on this page). The categories are broken down into Opioids Alone, Fentanyl, Stimulants Alone, Cocaine, Amphetamines, and Xylazine. Opioids are involved in nearly every overdose fatality for both years. Nearly every opioid fatality involves fentanyl. Stimulants, like cocaine and amphetamines, are seen only about half as often. Presence of all drugs included in this graph increased from 2022 to 2023. Presence of xylazine, a veterinary sedative that has been seen mixed into illicit drugs in recent years, has increased quickly from 2021 to 2023.