Preliminary Population Change Maps
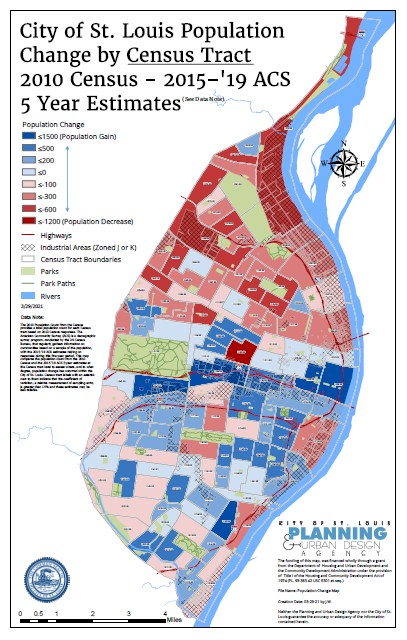
These maps compare population between the 2010 Census and the 2015-'19 ACS 5-year estimates to illustrate population change at the Census Tract and Block Group geographies. These population change maps are being released in advance of more detailed maps anticipated to be available later this year based on the 2020 Census results.
Publication Date: 03/31/2021
Document Type: Facts Figures and Demographics
Sponsor:
Planning & Urban Design Agency
Summary
The maps below illustrate population change utilizing a comparison between the 2010 Census population count and recently available population estimates from the 2015-'19 American Community Survey 5-year data at the Census Tract and Block Group geographies.
Download
Need Help Viewing?
You need a program that can open Adobe PDF files. A free option:
- Adobe Reader (can read PDF files)
Help Us Improve This Page
Did you notice an error? Is there information that you expected to find on this page, but didn't? Let us know below, and we'll work on it.
Feedback is anonymous.